Performance Monitor
Performance Monitor
If your site feels slow or you’re not sure why it’s not ranking as well as it should, the Performance Monitor gives you a clear picture of what’s holding it back — and exactly what to fix. It runs your site through Google PageSpeed Insights (a free analysis tool powered by Google’s Lighthouse engine that simulates how real users experience your pages) and surfaces scores across four key areas: speed, accessibility, best practices, and SEO.
You can run a scan any time you want a snapshot, or schedule them automatically so FlyWP builds a history you can track over time. This is especially useful after making changes like enabling caching or optimizing images — you’ll see the before-and-after impact in plain numbers.
What Gets Measured
Each scan evaluates your site across four categories:
| Category | What It Measures |
|---|---|
| Performance | Page load speed, interactivity, and visual stability. Scores are based on lab data simulating a real user experience. |
| Accessibility | How usable your site is for people with disabilities — including screen reader support, color contrast, and keyboard navigation. |
| Best Practices | Whether your site follows web development best practices, such as using HTTPS, avoiding deprecated APIs, and proper image formats. |
| SEO | How well your site is optimized for search engines, including meta tags, mobile-friendliness, crawlable links, and structured data. |
Each category receives a score from 0 to 100:
- 0–49 (red) — needs significant improvement
- 50–89 (orange) — room for improvement
- 90–100 (green) — good
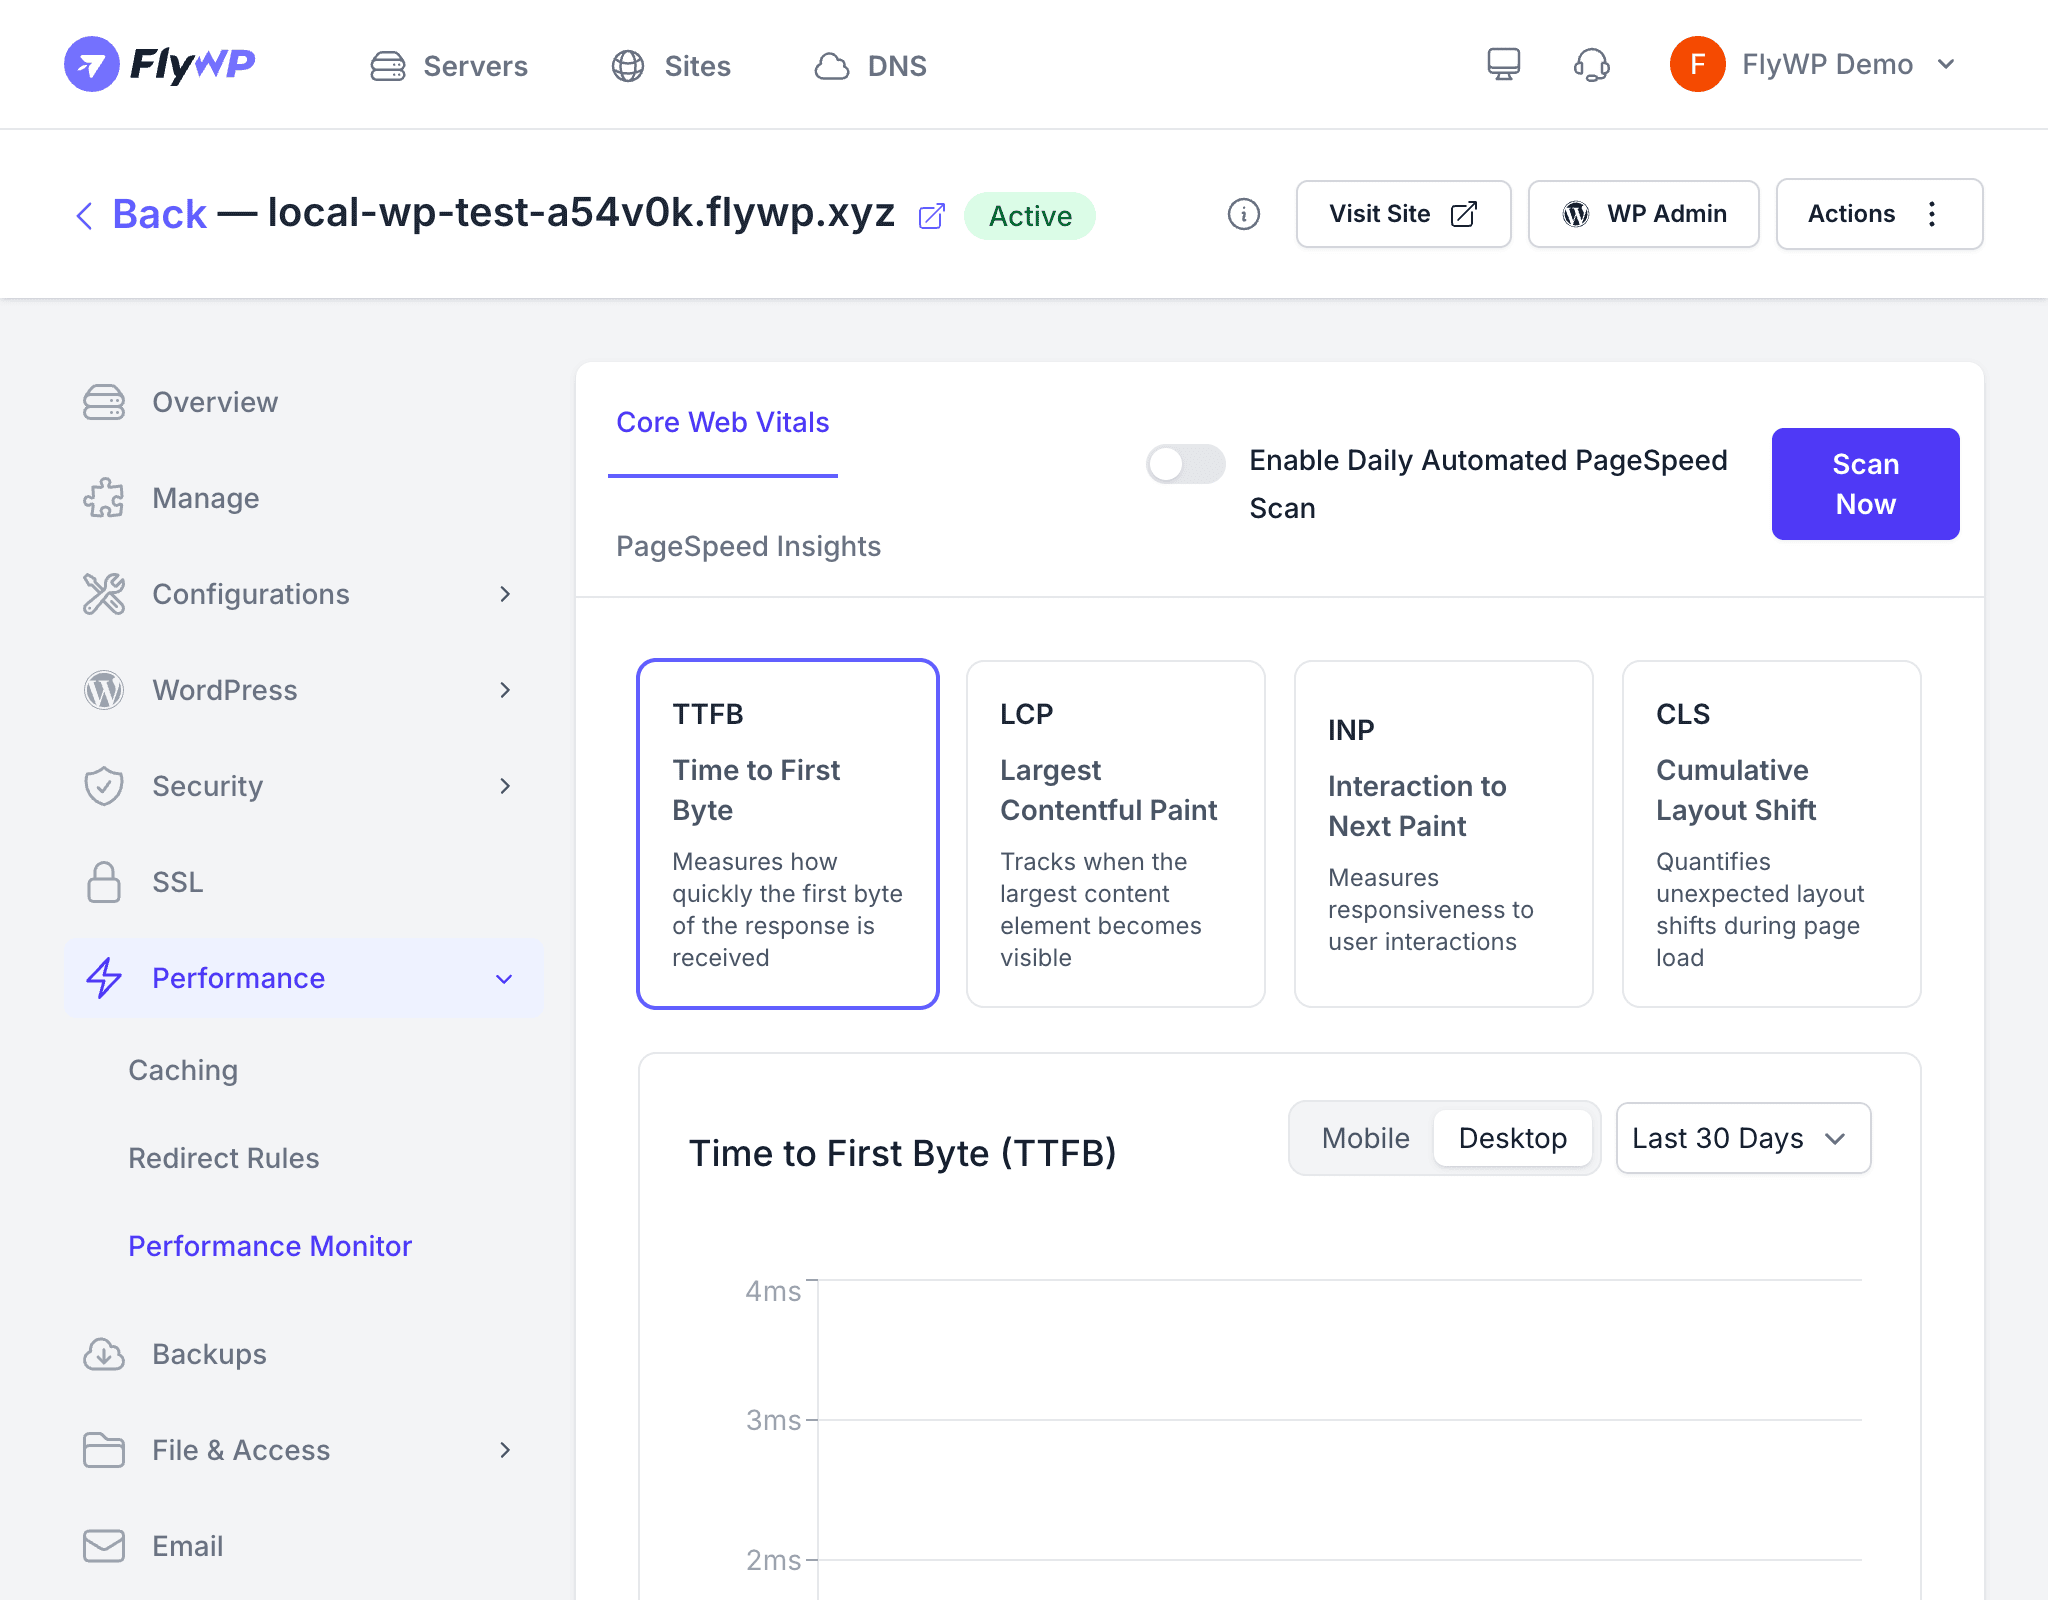
Core Web Vitals
The Performance Monitor also reports your Core Web Vitals — a set of real-world performance metrics that Google uses as ranking signals. Unlike the scores above (which are based on simulated lab conditions), Core Web Vitals reflect how actual visitors experience your site:
| Metric | What It Measures | Good Threshold |
|---|---|---|
| Largest Contentful Paint (LCP) | How long it takes for the main content to appear on screen | Under 2.5 seconds |
| Cumulative Layout Shift (CLS) | How much the page layout shifts unexpectedly during loading — for example, a button jumping before you click it | Under 0.1 |
| Interaction to Next Paint (INP) | How quickly the page responds after a user taps or clicks something | Under 200 milliseconds |
Running a Scan
Manual Scan
- Navigate to your site’s Performance Monitor tab.
- Click Run Scan.
- FlyWP sends your site’s URL to Google PageSpeed Insights and displays the results once the analysis is complete.
Automated Scans
Enable automated scans to run performance checks on a regular schedule. FlyWP stores each result so you can track trends over time — helpful for spotting regressions after a plugin update or content change.
Scan History
The scan history shows every performance scan FlyWP has run for your site. Each row includes:
- Date — when the scan was performed
- Performance score — the overall performance number
- Accessibility score — the accessibility rating
- Best Practices score — the best practices rating
- SEO score — the search engine optimization rating
Click any historical scan to view its full breakdown, including individual audit results and recommendations.
Acting on the Results
Each scan includes detailed audit results with specific, actionable recommendations. Common improvements include:
- Enable caching — use FlyWP’s FastCGI Cache and Object Cache (server-side caches that store pre-built pages so PHP doesn’t have to rebuild them on every visit) to speed up response times
- Optimize images — compress and serve images in modern formats like WebP
- Minimize JavaScript and CSS — reduce the size of render-blocking resources (files that pause page rendering until they finish downloading)
- Use lazy loading — defer loading of off-screen images and iframes until the user scrolls toward them
- Improve server response time — check your PHP settings and hosting resources