Uptime Monitor
Uptime Monitor
Downtime costs you visitors, sales, and trust — and the worst part is often finding out from a frustrated customer rather than from your own monitoring. The Uptime Monitor watches your site around the clock and notifies you the moment something goes wrong, so you can act before most people ever notice.
FlyWP continuously checks whether your site is accessible, records each incident (a period of detected downtime), and sends you alerts when your site goes down or comes back up. You get a clear picture of your site’s reliability over time — not just a guess.
Setting Up Uptime Monitoring
- Navigate to your site’s Uptime Monitor tab.
- Enable the uptime monitor toggle.
- Configure the check interval — how frequently FlyWP pings your site (e.g., every 1 minute, 5 minutes, or 10 minutes).
Once enabled, FlyWP begins checking your site at the specified interval and recording the results automatically.
How It Works
At each check interval, FlyWP sends an HTTP request (a standard web request, like a browser loading your page) to your site. If the site responds with a successful status code — the server’s way of saying “everything is fine” — your site is marked as up. If the request fails or returns an error code, FlyWP waits and retries to rule out a momentary blip before marking your site as down and triggering an alert.
Viewing Uptime Statistics
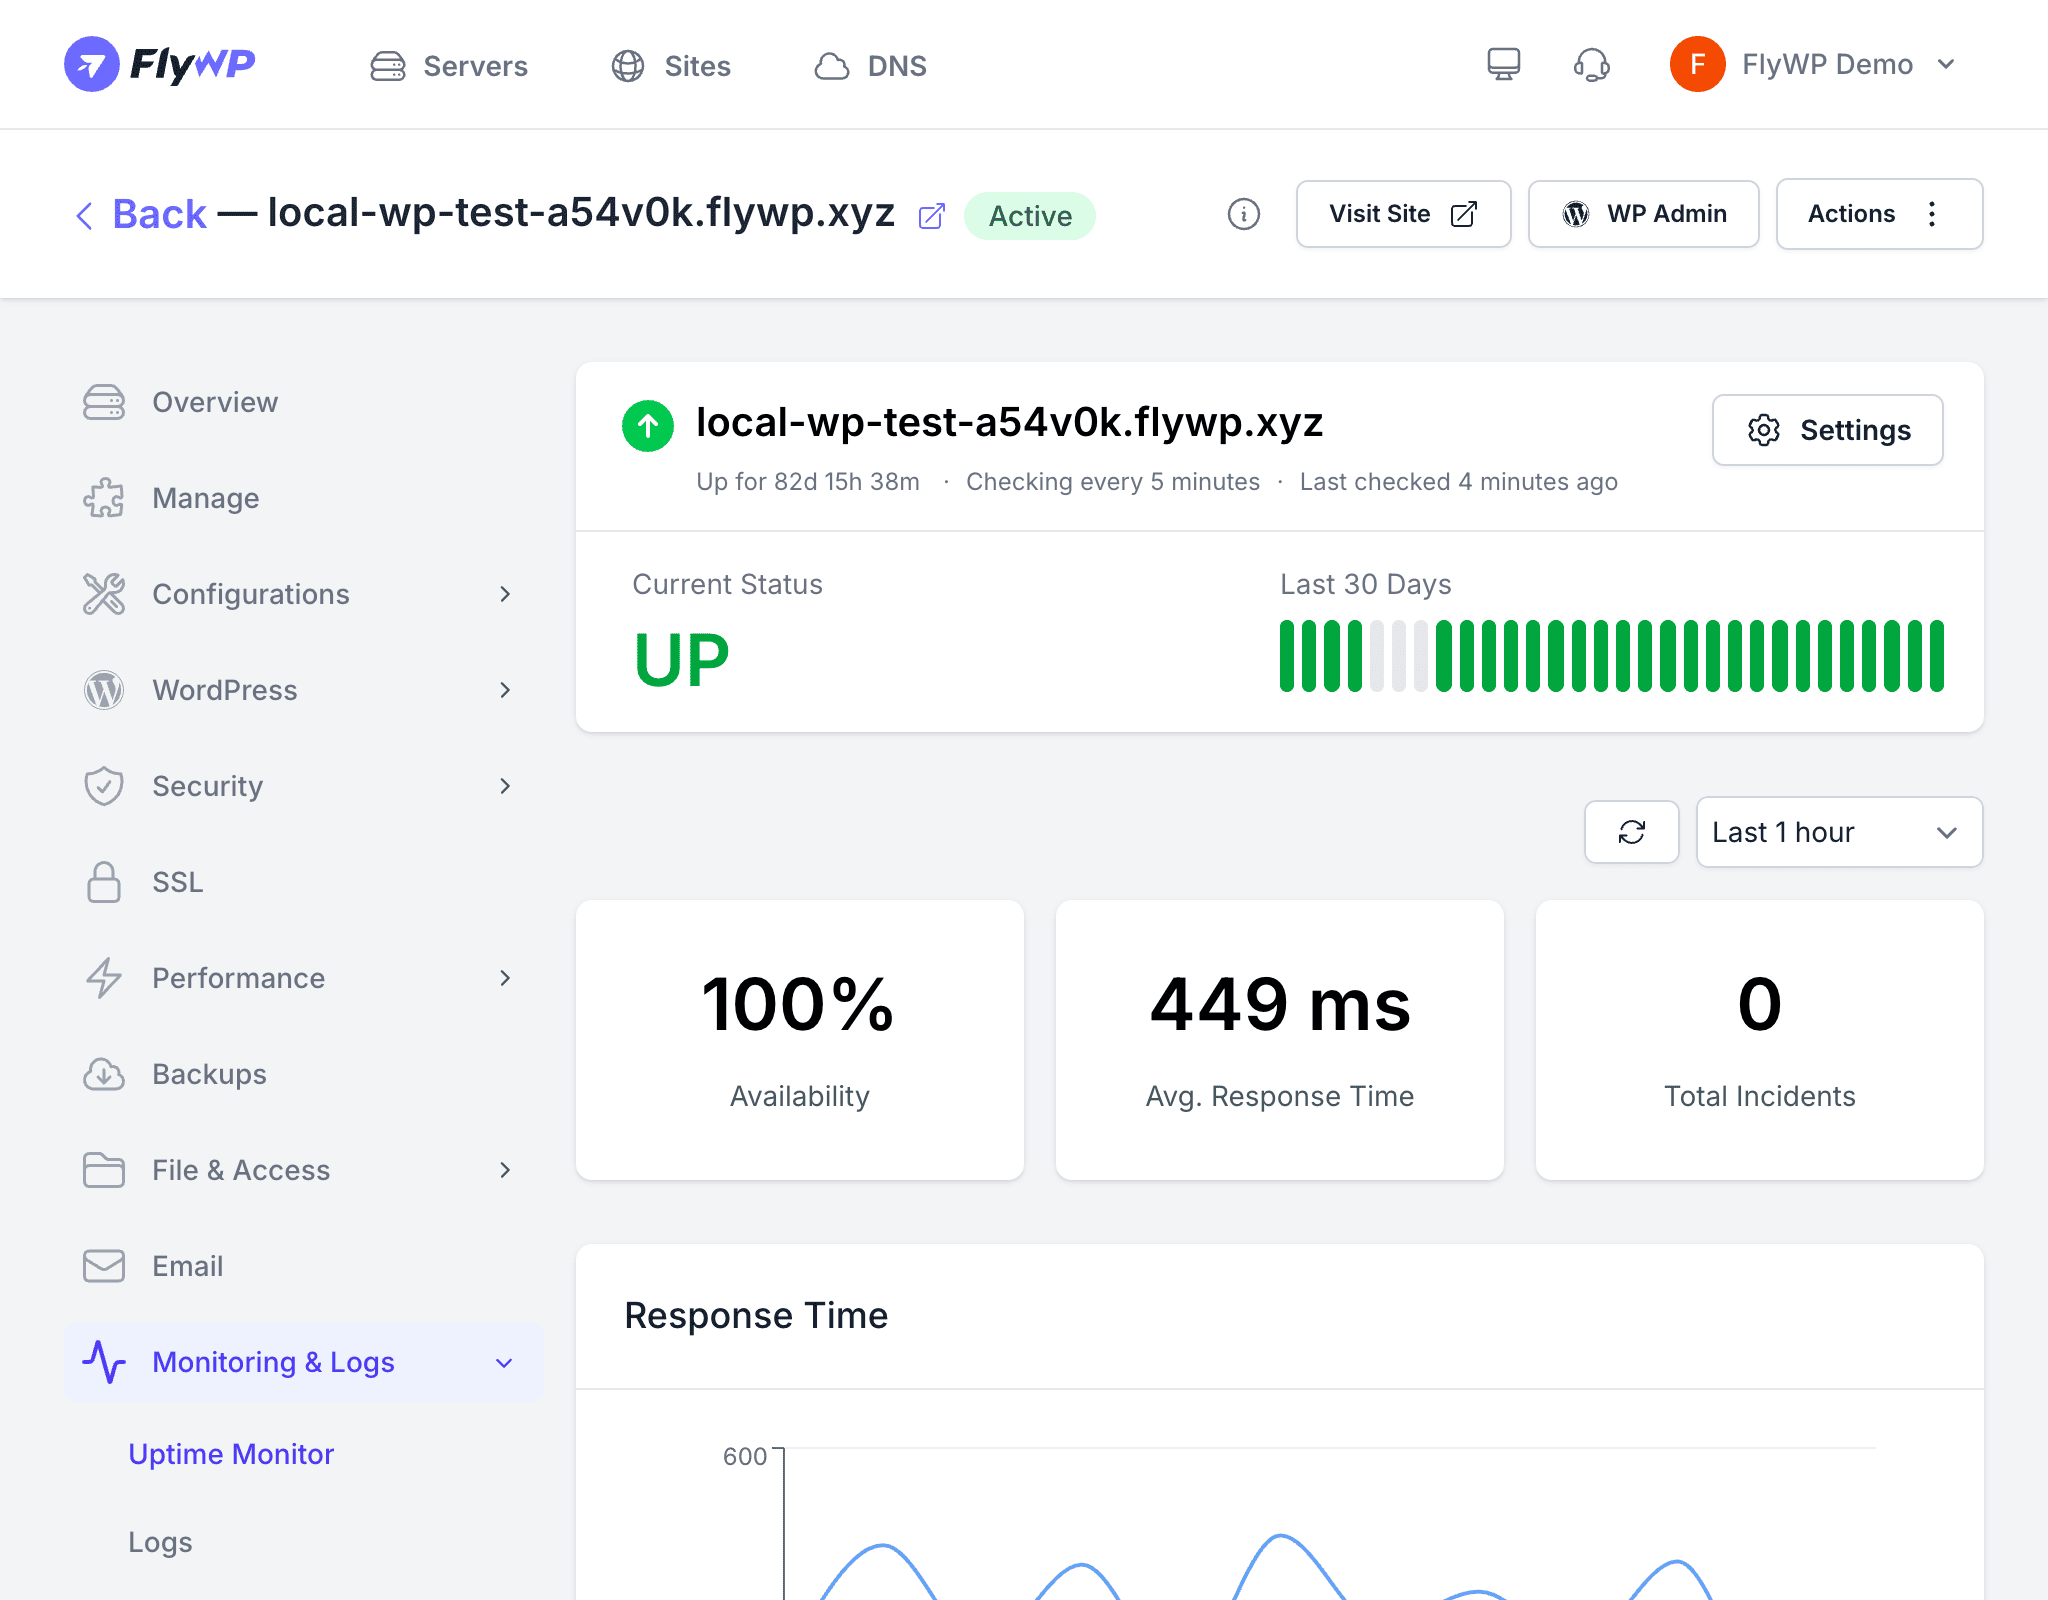
The Uptime Monitor dashboard gives you a full picture of your site’s availability history:
- Current status — whether your site is up or down right now
- Uptime percentage — the share of time your site has been available over a selected period
- Response time graph — a visual chart of how quickly your site responds over time, useful for spotting performance trends before they become real problems
- Incident history — a chronological list of downtime incidents with start time, end time, and duration
Incidents and Downtime
When your site goes down, FlyWP records an incident — a timestamped log of the outage. Each incident captures:
- Start time — when the downtime was first detected
- End time — when the site came back online
- Duration — how long the site was unreachable
- Root cause (if identifiable) — the HTTP error code (a numeric code the server returns to describe what went wrong) or connection failure type
Alerts
FlyWP notifies you when your site goes down through the notification channels configured in your account settings. You receive an alert when:
- Your site becomes unreachable (downtime starts)
- Your site recovers and is accessible again (downtime ends)
Best Practices
- Use a 1-minute check interval for production sites where downtime directly affects revenue or users
- Use a 5-minute interval for staging or lower-priority sites to reduce unnecessary monitoring overhead
- Review incidents regularly even if your site recovers quickly — repeated short outages can point to an underlying problem worth investigating
- Combine with performance monitoring to catch slow degradation before it turns into full downtime