Server Status
Server Status
When a site slows down or your server starts behaving unexpectedly, the first thing you want to know is: what is actually consuming resources right now? The Status tab answers that question instantly — showing you CPU (processing power), memory, and disk usage at both the server level and broken down by individual site. Whether you are troubleshooting a performance problem or doing a routine health check after a new deployment, this is your starting point.
Server Status Section
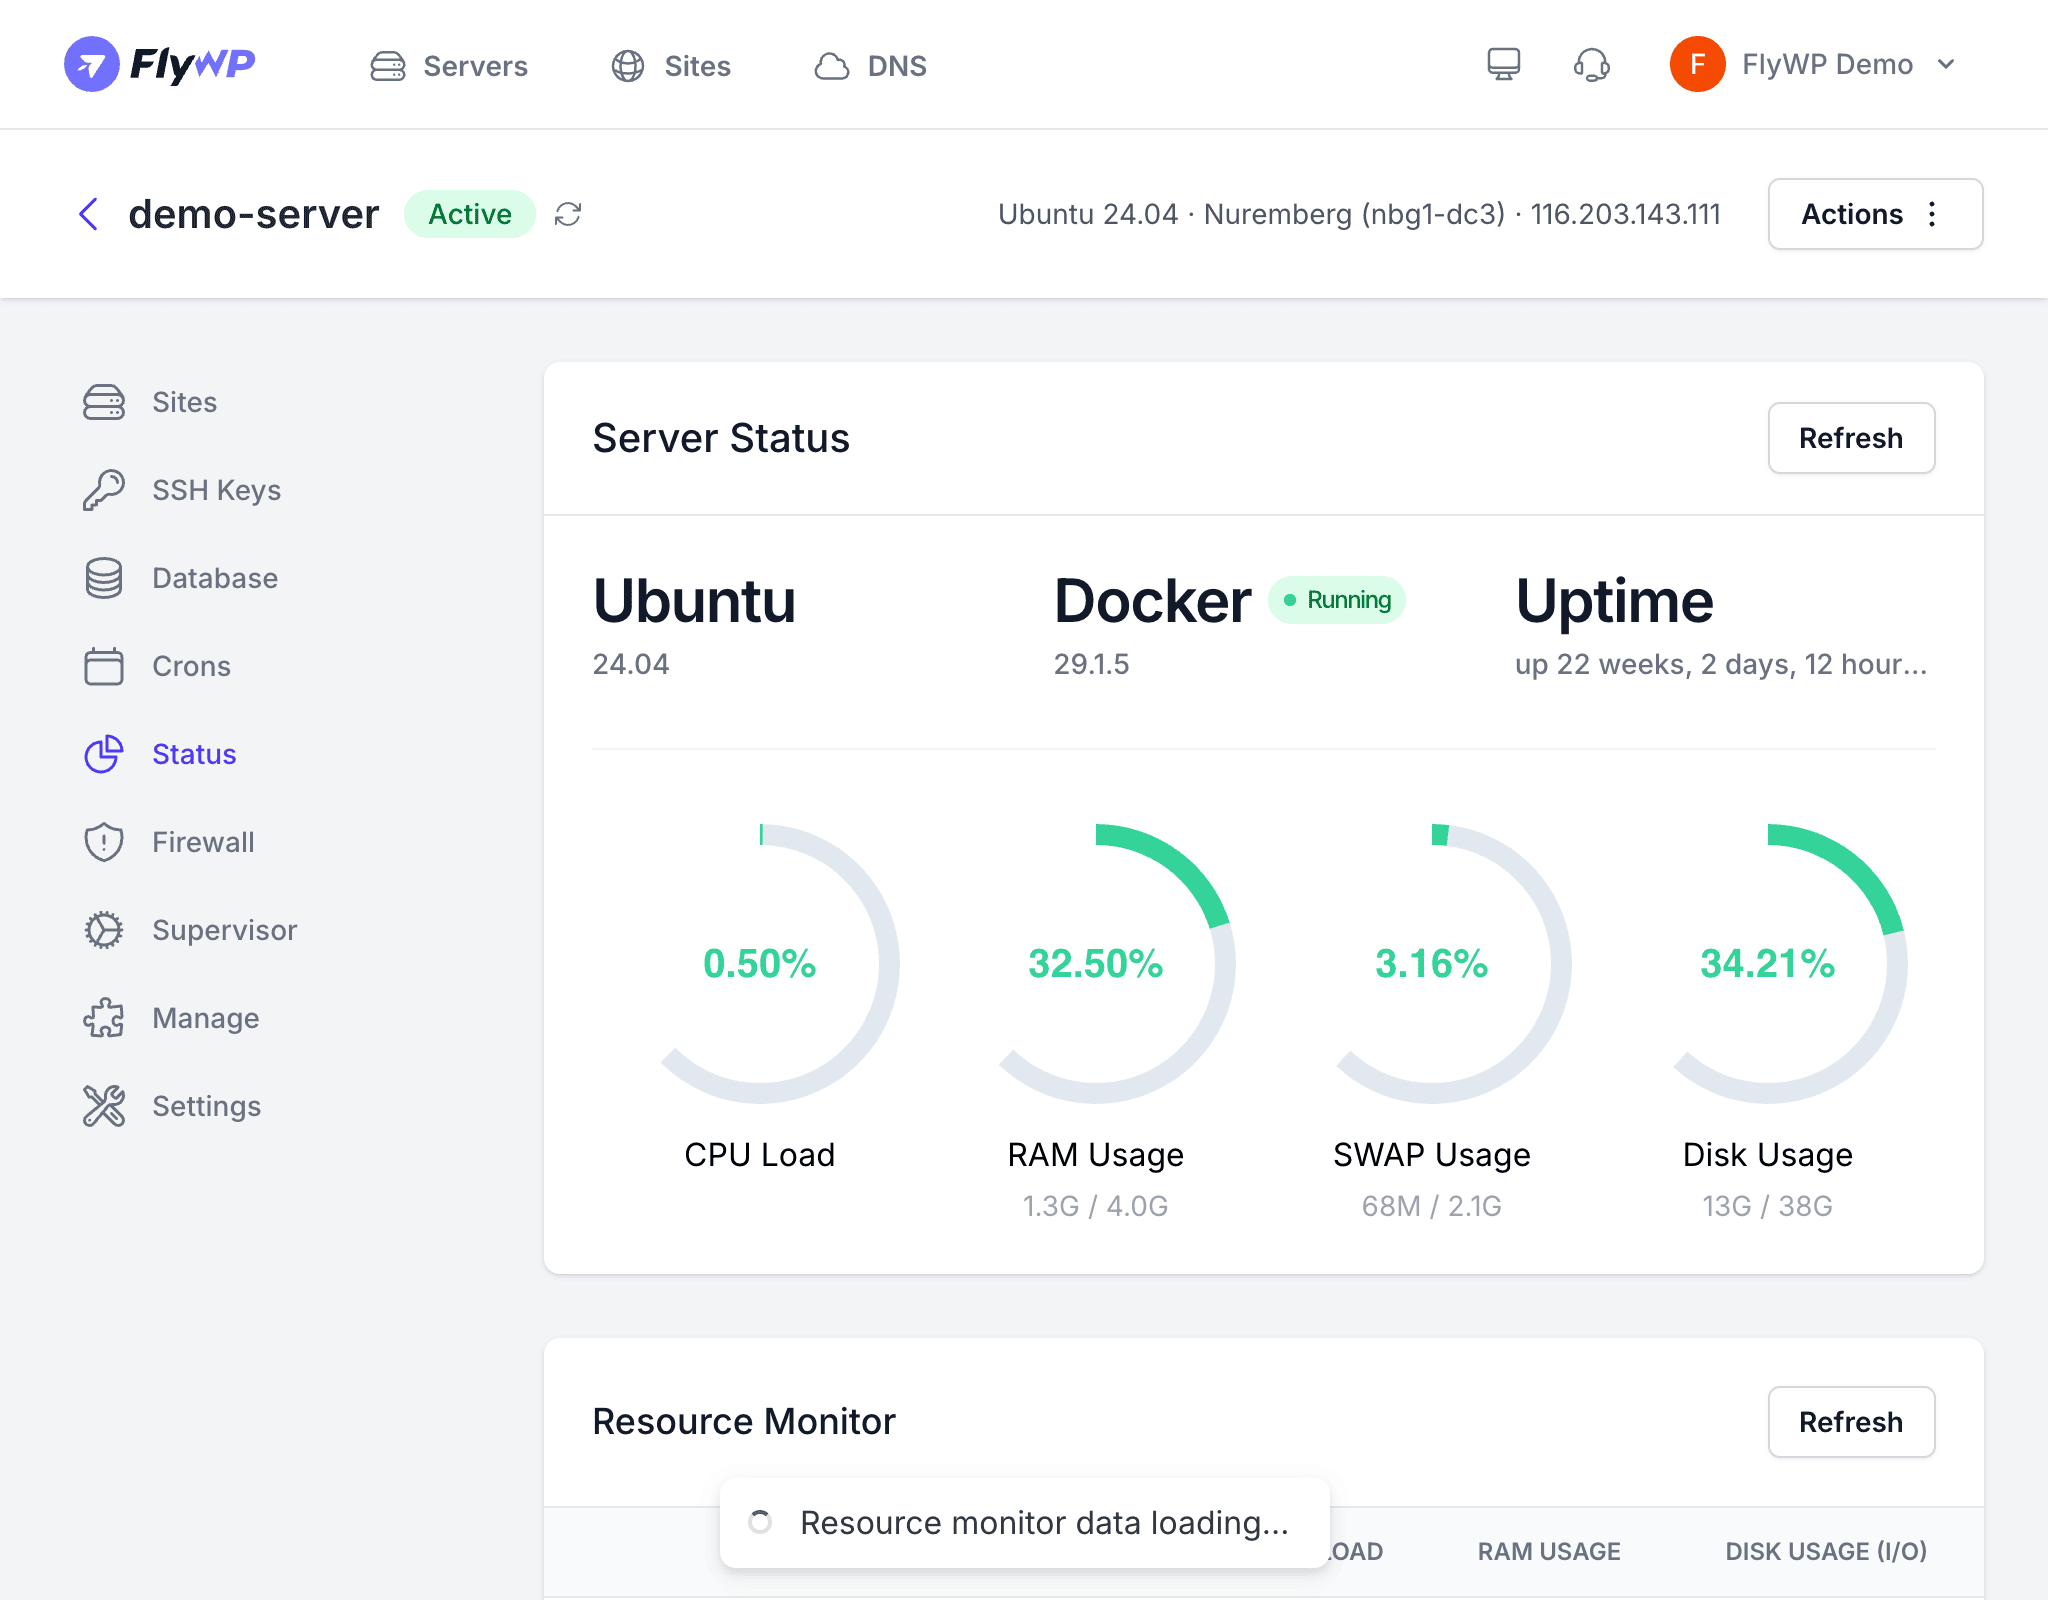
At the top of the page, FlyWP surfaces key system information about your server:
| Field | Description |
|---|---|
| Ubuntu Version | The operating system version running on your server (e.g., Ubuntu 24.04 LTS) |
| Docker Status | Whether Docker (the containerization engine FlyWP uses to isolate and run each site) is active — should always show Running |
| Uptime | How long the server has been running since its last reboot |
Resource Gauges
Four visual gauges give you an at-a-glance picture of current resource consumption. Think of them as the dashboard instruments for your server.
CPU Load
Displays the current CPU load percentage — how hard your server’s processor is working. A consistently high CPU load (above 80%) may indicate your server needs more processing power, or that a specific site is consuming too many resources.
RAM Usage
Shows how much memory (RAM — the fast, temporary working space your server uses to run active processes) is in use versus the total available. For example, 1.2 GB / 2 GB means 1.2 GB of your 2 GB RAM is currently in use.
SWAP Usage
Shows how much swap space is in use versus the total available. Swap is disk space your server borrows as emergency overflow when it runs out of physical RAM — it works, but it is much slower. High swap usage is a reliable sign your server needs a memory upgrade.
Disk Usage
Shows how much disk storage is in use versus the total available. FlyWP monitors this so you can act before your server runs out of space, which would prevent sites from saving files, processing uploads, or functioning at all.
If any resource gauge is consistently above 90%, take action. Upgrade your server size, optimize your sites, or move some sites to a different server. Running out of RAM or disk space can cause site crashes and data loss.
Resource Monitor
Below the gauges, a Resource Monitor table breaks down resource usage by individual site. This is where you find the culprit when one site is dragging down the whole server.
| Column | Description |
|---|---|
| Site | The WordPress site name |
| CPU Load | Percentage of CPU this site is consuming |
| RAM Usage | Amount of memory this site is using |
| Disk Usage (I/O) | Disk read/write activity (I/O — input/output) for this site |
When you run multiple sites on one server, this table tells you exactly which site is responsible for a resource spike — so you can take targeted action rather than guessing.
Refreshing Data
The status page does not auto-refresh. Click the Refresh button to fetch the latest resource data from your server whenever you want an updated snapshot.
Understanding the Numbers
Not sure what the numbers mean? Here are practical thresholds to guide your decisions:
- CPU Load below 70% — healthy, your server has comfortable headroom.
- CPU Load 70–90% — elevated; keep an eye on it during peak traffic.
- CPU Load above 90% — critical; consider upgrading your plan or optimizing heavy plugins.
- RAM usage near total with high SWAP — your server needs more memory.
- Disk usage above 80% — start planning for more storage, or clean up old backups and logs.
Best Practices
- Check status after major changes — new site deployments, plugin activations, or sudden traffic spikes can all shift your resource baseline.
- Use the per-site breakdown to find resource-hungry sites before they affect other sites on the server.
- Set a maintenance window in Server Settings so FlyWP can perform routine maintenance during off-peak hours.